Description
A monthly management report for a business that doesn’t have a finance team.
Enter eleven numbers a month. Get nineteen KPIs, twelve of them scored against your own targets with a red/amber/green status, and an honest answer to the question that keeps owners awake: how many months of cash have I got left?
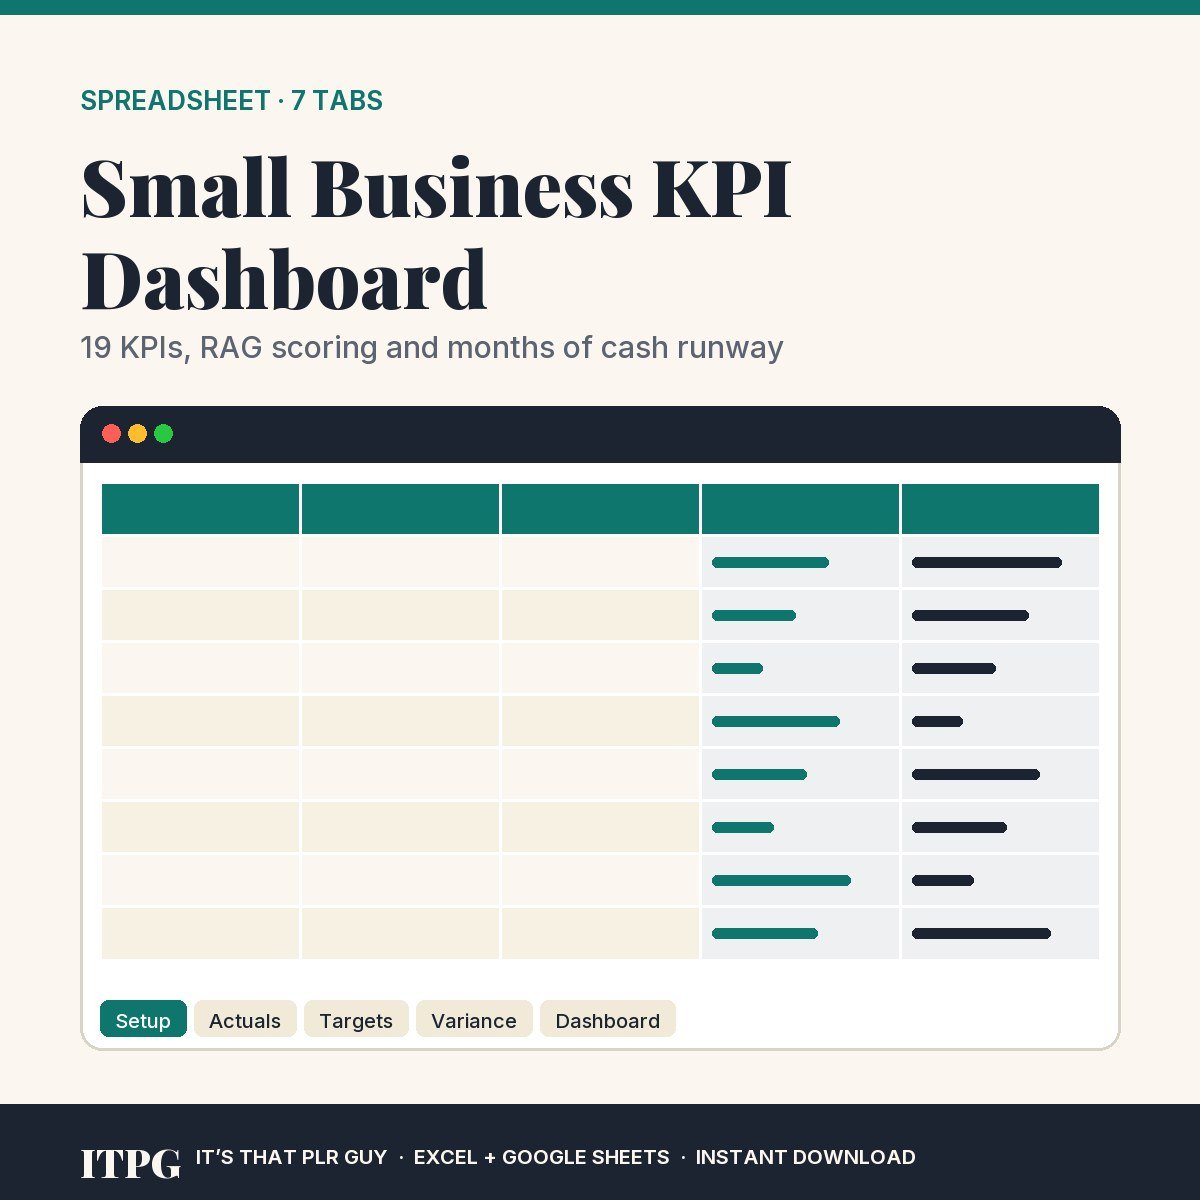
What’s inside (7 tabs)
- Start Here — including a plain-English definition of every calculated KPI
- Setup — business name, year, opening cash, and how strict the scoring should be
- Actuals — the one tab you type into. Eleven cream rows a month.
- Targets — what you’re aiming at. Leave rows blank and they’re simply not scored.
- Variance — actual vs target with a RAG status
- Cash & Runway — monthly cash, burn rate, and months of runway remaining
- Dashboard — twelve headline numbers, a written read of your position, two charts
The KPIs it works out for you
Gross profit and margin · net profit and margin · average order value · session-to-order rate · lead-to-customer rate · repeat customer rate · refund rate · cost to acquire a customer · marketing as a share of revenue · cash movement · cash runway.
Two things it gets right that most don’t
Targets are pro-rated to the months you’ve actually filled in — so three months of trading is compared against three months of plan, not against the whole year. And cost metrics are scored the right way round: under budget on marketing spend is a win, not a miss.
Laid out like real management accounts
Metrics down the side, months across the top. If you ever hand it to a bookkeeper or an accountant, it will read the way they expect.
Works in
Microsoft Excel (2016 or newer) and Google Sheets. Three months of sample figures are included so every tab demonstrates itself — delete them and start.
INSTANT DOWNLOAD — one .xlsx file, available immediately.
Licence
Personal and commercial use by you, for your own business. No reselling or sharing.
Digital files can’t be returned once downloaded. Contact us with any questions first.